Visualization
Igraph & Networkx
igraph
igraph
This Python Script has the codes for igraph
Note: igraph cannot read in txt file with header,and columns can only be separated by white spaces
In [1]:
#Import libraries
import matplotlib.pyplot as plt
from igraph import *
import igraph
import pandas as pd
Test Dataset
In [2]:
#Import test data I created by using Read_Ncol,
#and set the network as directed by using directed = True
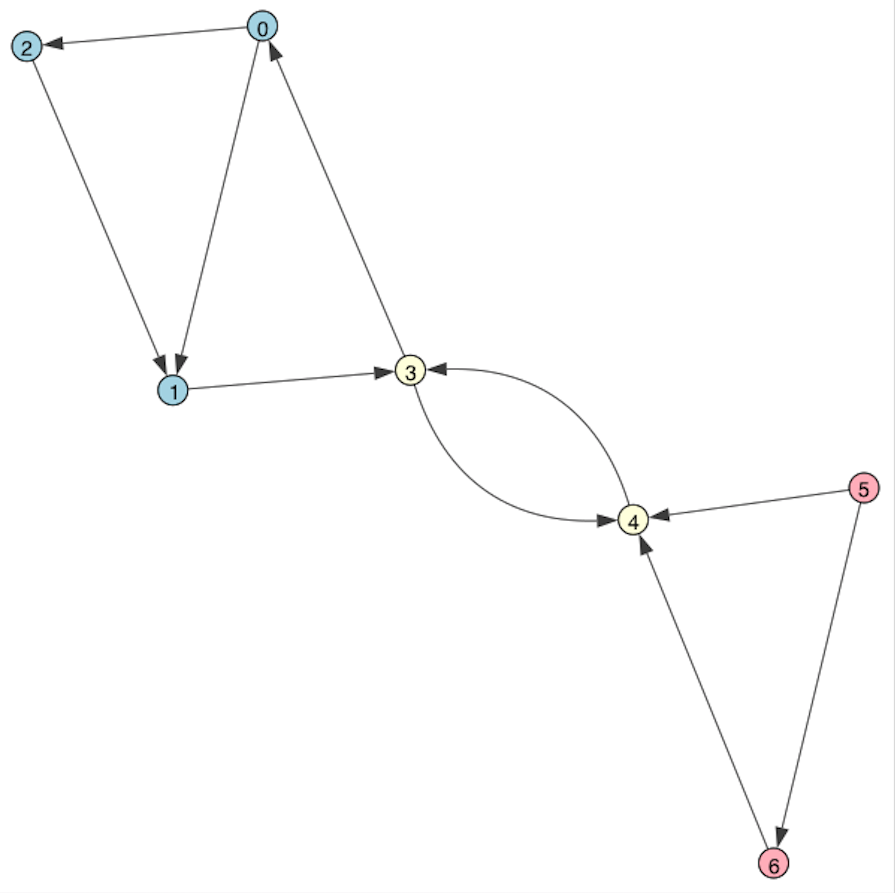
test_igraph = Graph.Read_Ncol('Test_Dataset.txt', names = True, directed = True)

#Use Print to see infomation about this network(how big is the network)
#7 nodes, 10 edges
print(test_igraph)
IGRAPH DN-- 7 10 --
+ attr: name (v)
+ edges (vertex names):
0->1, 0->2, 1->3, 2->1, 3->0, 3->4, 4->3, 5->4, 5->6, 6->4
In [3]:
#Set all the visualization style into a dictionary called visual_style
visual_style = {}
#Let the plot print out default vertext label
visual_style['vertex_label'] = test_igraph.vs['name']
visual_style['margin'] = 20
#Set layout format and print the network
layout = test_igraph.layout('kk')
In [4]:
#Change the nodes' color by nodes' index label, with 0~2: lightblue, 3~4:lightyellow, 5~6: lightpink
%matplotlib inline
color_dict = {"0": "lightblue", "1":"lightblue", "2":"lightblue",
              "3": "lightyellow", "4": "lightyellow", "5": "lightpink", "6": "lightpink"}
#Add visual commands for each vertex label in name
visual_style["vertex_color"] = [color_dict[name] for name in test_igraph.vs["name"]]


plot1 = igraph.plot(test_igraph, **visual_style, layout = layout)
plot1.show()


#Calculate the density of the graph
test_igraph.density()
Out[4]:
0.2380952380952381
Game of Thrones Network
In [5]:
#Import and open the downloaded Game of Thrones(got) dataset from
#https://www.macalester.edu/~abeverid/thrones.html
#with names=true: can plot nodes input names, direct = True: directed network, weights=true: weighted networks
with open('stormofswords.txt', 'r', encoding = 'utf-8') as input_file:
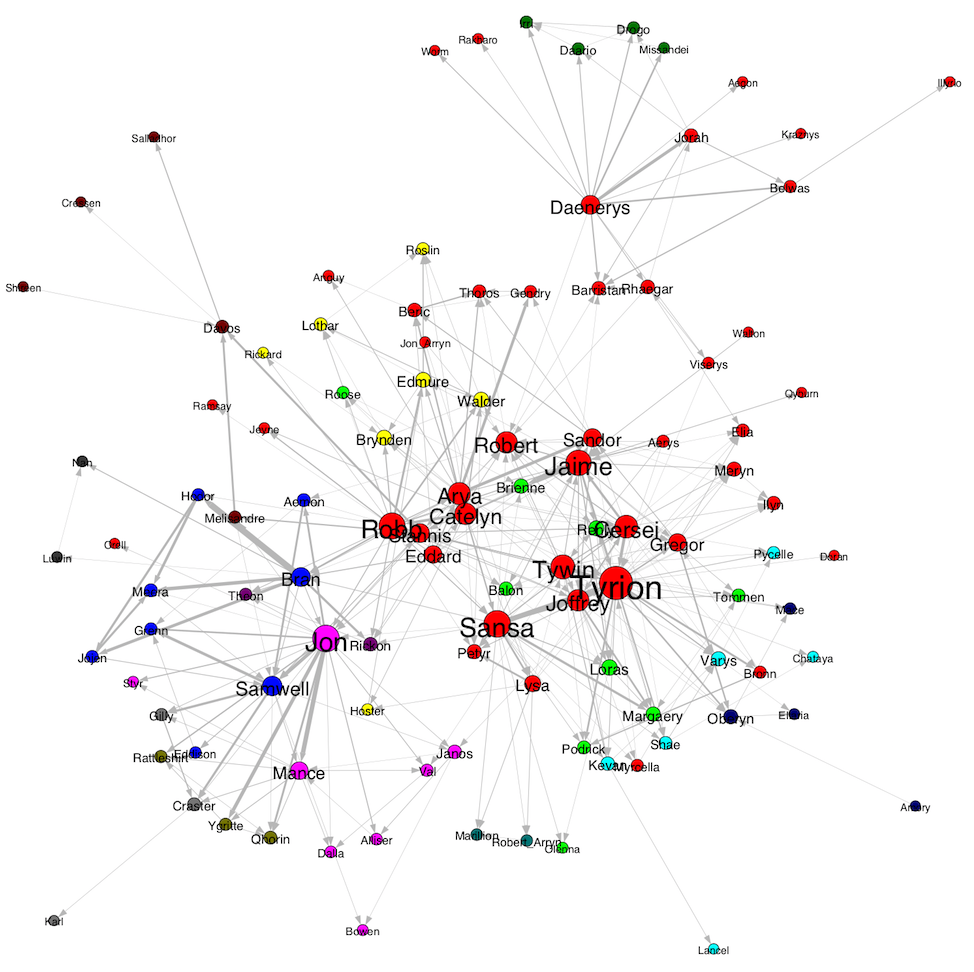
    got = igraph.Graph.Read_Ncol(input_file, names=True, directed = True, weights = True)
    print(input_file)
<_io.TextIOWrapper name='stormofswords.txt' mode='r' encoding='utf-8'>
In [6]:
#Use Print to see infomation about this network(how big is the network)
print(got)
summary(got)
#Calculate the density of the graph
got.density()
IGRAPH DNW- 107 352 --
+ attr: name (v), weight (e)
+ edges (vertex names):
Aemon->Grenn, Aemon->Samwell, Aerys->Jaime, Aerys->Robert, Aerys->Tyrion,
Aerys->Tywin, Alliser->Mance, Amory->Oberyn, Arya->Anguy, Arya->Beric,
Arya->Bran, Arya->Brynden, Arya->Cersei, Arya->Gendry, Arya->Gregor,
Arya->Jaime, Arya->Joffrey, Arya->Jon, Arya->Rickon, Arya->Robert,
Arya->Roose, Arya->Sandor, Arya->Thoros, Arya->Tyrion, Balon->Loras,
Belwas->Barristan, Belwas->Illyrio, Beric->Anguy, Beric->Gendry,
Beric->Thoros, Bran->Hodor, Bran->Jojen, Bran->Jon, Bran->Luwin, Bran->Meera,
Bran->Nan, Bran->Rickon, Bran->Samwell, Bran->Theon, Brienne->Loras,
Bronn->Gregor, Bronn->Podrick, Brynden->Lothar, Brynden->Walder,
Catelyn->Bran, Catelyn->Brienne, Catelyn->Brynden, Catelyn->Cersei,
Catelyn->Edmure, Catelyn->Hoster, Catelyn->Jaime, Catelyn->Jeyne,
Catelyn->Lysa, Catelyn->Petyr, Catelyn->Robb, Catelyn->Roose, Catelyn->Roslin,
Catelyn->Sansa, Catelyn->Stannis, Catelyn->Tyrion, Catelyn->Walder,
Cersei->Brienne, Cersei->Bronn, Cersei->Elia, Cersei->Gregor, Cersei->Ilyn,
Cersei->Jaime, Cersei->Joffrey, Cersei->Meryn, Cersei->Pycelle,
Cersei->Robert, Cersei->Sandor, Cersei->Shae, Cersei->Tyrion, Cersei->Varys,
Craster->Karl, Daario->Drogo, Daario->Irri, Daenerys->Aegon,
Daenerys->Barristan, Daenerys->Belwas, Daenerys->Daario, Daenerys->Drogo,
Daenerys->Irri, Daenerys->Jorah, Daenerys->Kraznys, Daenerys->Missandei,
Daenerys->Rakharo, Daenerys->Rhaegar, Daenerys->Robert, Daenerys->Viserys,
Daenerys->Worm, Davos->Cressen, Davos->Salladhor, Eddard->Arya, Eddard->Beric,
Eddard->Bran, Eddard->Catelyn, Eddard->Cersei, Eddard->Jaime, Eddard->Jon,
Eddard->Rickon, Eddard->Robb, Eddard->Robert, Eddard->Sandor, Eddard->Sansa,
Eddison->Grenn, Edmure->Brynden, Edmure->Lothar, Edmure->Roslin,
Edmure->Walder, Gendry->Thoros, Gilly->Craster, Gregor->Elia, Gregor->Ilyn,
Gregor->Meryn, Gregor->Oberyn, Gregor->Sandor, Hodor->Jojen, Hodor->Meera,
Hoster->Edmure, Irri->Drogo, Jaime->Balon, Jaime->Barristan, Jaime->Brienne,
Jaime->Edmure, Jaime->Elia, Jaime->Gregor, Jaime->Joffrey, Jaime->Loras,
Jaime->Meryn, Jaime->Qyburn, Jaime->Renly, Jaime->Robert, Jaime->Stannis,
Jaime->Tommen, Jaime->Tyrion, Janos->Alliser, Janos->Bowen, Janos->Mance,
Joffrey->Gregor, Joffrey->gt;Ilyn, Joffrey->Kevan, Joffrey->Loras,
Joffrey->Margaery, Joffrey->Meryn, Joffrey->Myrcella, Joffrey->Oberyn,
Joffrey->Sandor, Joffrey->Stannis, Joffrey->Tommen, Joffrey->Tyrion,
Jojen->Meera, Jojen->Samwell, Jon->Aemon, Jon->Alliser, Jon->Craster,
Jon->Dalla, Jon->Eddison, Jon->Gilly, Jon->Grenn, Jon->Janos, Jon->Mance,
Jon->Meera, Jon->Melisandre, Jon->Orell, Jon->Qhorin, Jon->Rattleshirt,
Jon->Robert, Jon->Samwell, Jon->Stannis, Jon->Styr, Jon->Theon, Jon->Val,
Jon->Ygritte, Jon_Arryn->Lysa, Jon_Arryn->Robert, Jorah->Barristan,
Jorah->Belwas, Jorah->Daario, Jorah->Drogo, Kevan->Lancel, Kevan->Varys,
Loras->Margaery, Loras->Olenna, Lothar->Roslin, Luwin->Nan, Lysa->Cersei,
Lysa->Hoster, Lysa->Marillion, Lysa->Petyr, Lysa->Robert_Arryn, Lysa->Tyrion,
Lysa->Tywin, Mance->Craster, Mance->Dalla, Mance->Gilly, Mance->Qhorin,
Mance->Rattleshirt, Mance->Styr, Mance->Val, Mance->Ygritte, Meera->Samwell,
Melisandre->Davos, Melisandre->Samwell, Meryn->Ilyn, Missandei->Irri,
Myrcella->Tommen, Myrcella->Tyrion, Oberyn->Ellaria, Oberyn->Mace,
Podrick->Margaery, Rattleshirt->Qhorin, Renly->Loras, Renly->Margaery,
Renly->Varys, Rhaegar->Barristan, Rhaegar->Elia, Rhaegar->Jorah,
Rhaegar->Robert, Rickard->Brynden, Rickon->Theon, Robb->Arya, Robb->Balon,
Robb->Bran, Robb->Brienne, Robb->Brynden, Robb->Edmure, Robb->Hodor,
Robb->Jaime, Robb->Jeyne, Robb->Joffrey, Robb->Jon, Robb->Lothar, Robb->Petyr,
Robb->Ramsay, Robb->Rickard, Robb->Rickon, Robb->Roose, Robb->Sansa,
Robb->Stannis, Robb->Theon, Robb->Tyrion, Robb->Tywin, Robb->Walder,
Robert->Aemon, Robert->Barristan, Robert->Renly, Robert->Stannis,
Robert->Thoros, Robert_Arryn->Marillion, Roose->Brienne, Samwell->Bowen,
Samwell->Craster, Samwell->Eddison, Samwell->Gilly, Samwell->Grenn,
Samwell->Janos, Samwell->Mance, Samwell->Qhorin, Sandor->Beric,
Sandor->Gendry, Sandor->Ilyn, Sandor->Meryn, Sandor->Robert, Sandor->Thoros,
Sansa->Arya, Sansa->Bran, Sansa->Brienne, Sansa->Cersei, Sansa->Jaime,
Sansa->Joffrey, Sansa->Jon, Sansa->Kevan, Sansa->Loras, Sansa->Lysa,
Sansa->Margaery, Sansa->Marillion, Sansa->Myrcella, Sansa->Olenna,
Sansa->Petyr, Sansa->Podrick, Sansa->Renly, Sansa->Rickon, Sansa->Robert,
Sansa->Robert_Arryn, Sansa->Sandor, Sansa->Shae, Sansa->Tyrion, Shae->Chataya,
Shae->Varys, Shireen->Davos, Stannis->Aemon, Stannis->Balon, Stannis->Davos,
Stannis->Melisandre, Stannis->Renly, Stannis->Samwell, Tommen->Margaery,
Tyrion->Balon, Tyrion->Bronn, Tyrion->Chataya, Tyrion->Doran, Tyrion->Elia,
Tyrion->Ellaria, Tyrion->Gregor, Tyrion->Ilyn, Tyrion->Janos, Tyrion->Kevan,
Tyrion->Loras, Tyrion->Mace, Tyrion->Margaery, Tyrion->Meryn, Tyrion->Oberyn,
Tyrion->Petyr, Tyrion->Podrick, Tyrion->Pycelle, Tyrion->Renly,
Tyrion->Robert, Tyrion->Sandor, Tyrion->Shae, Tyrion->Stannis, Tyrion->Varys,
Tywin->Balon, Tywin->Brynden, Tywin->Cersei, Tywin->Gregor, Tywin->Jaime,
Tywin->Joffrey, Tywin->Kevan, Tywin->Mace, Tywin->Oberyn, Tywin->Petyr,
Tywin->Podrick, Tywin->Pycelle, Tywin->Robert, Tywin->Stannis, Tywin->Tommen,
Tywin->Tyrion, Tywin->Val, Tywin->Varys, Tywin->Walder, Val->Dalla,
Varys->Pycelle, Viserys->Rhaegar, Viserys->Tyrion, Walder->Lothar,
Walder->Petyr, Walder->Roslin, Walton->Jaime, Ygritte->Qhorin,
Ygritte->Rattleshirt
IGRAPH DNW- 107 352 --
+ attr: name (v), weight (e)
Out[6]:
0.031035090812907777
In [7]:
#Change the weight for each row by proportion, so that I can get better visuals for edge widths
weight = []
for i in range(len(got.es['weight'])):
    weight.append(got.es['weight'][i]/10)

#Set the size for each vertex and vertex label based on degree,
#so the vertex and labels with higher degree can have bigger sized nodes and labels
size = []
for i in range(len(got.degree())):
    size.append(got.degree()[i]+15)
In [8]:
#Set visual commands
vis_style = {}
vis_style["vertex_label"] = got.vs["name"]
vis_style["vertex_label_size"] = size
vis_style["vertex_label_color"] = 'black'
vis_style["vertex_size"] = size
vis_style["edge_color"] = 'silver'
vis_style["edge_width"] = weight
#Set the margin near the plot's edge
vis_style["margin"] = 40
vis_style["bbox"] = (1500, 1500)
In [9]:
#Change nodes color based on degree
#Check the frequency of each elements in the degree list
dict((x,got.degree().count(x)) for x in set(got.degree()))
Out[9]:
{1: 16,
 2: 12,
 3: 8,
 4: 20,
 5: 11,
 6: 9,
 7: 6,
 8: 4,
 9: 1,
 10: 1,
 12: 3,
 13: 1,
 14: 3,
 15: 1,
 18: 3,
 19: 1,
 20: 1,
 22: 1,
 24: 1,
 25: 1,
 26: 2,
 36: 1}
In [10]:
#Find the comminities in the networks
i = got.community_infomap()
#This will give me 14 colors
pal = igraph.drawing.colors.ClusterColoringPalette(len(i))
got.vs['color'] = pal.get_many(i.membership)

#Set Layout format
layout = got.layout("kk")
pl1 = igraph.plot(got,layout = layout, **vis_style)
pl1.show()
Les Miserables (gml)
In [11]:
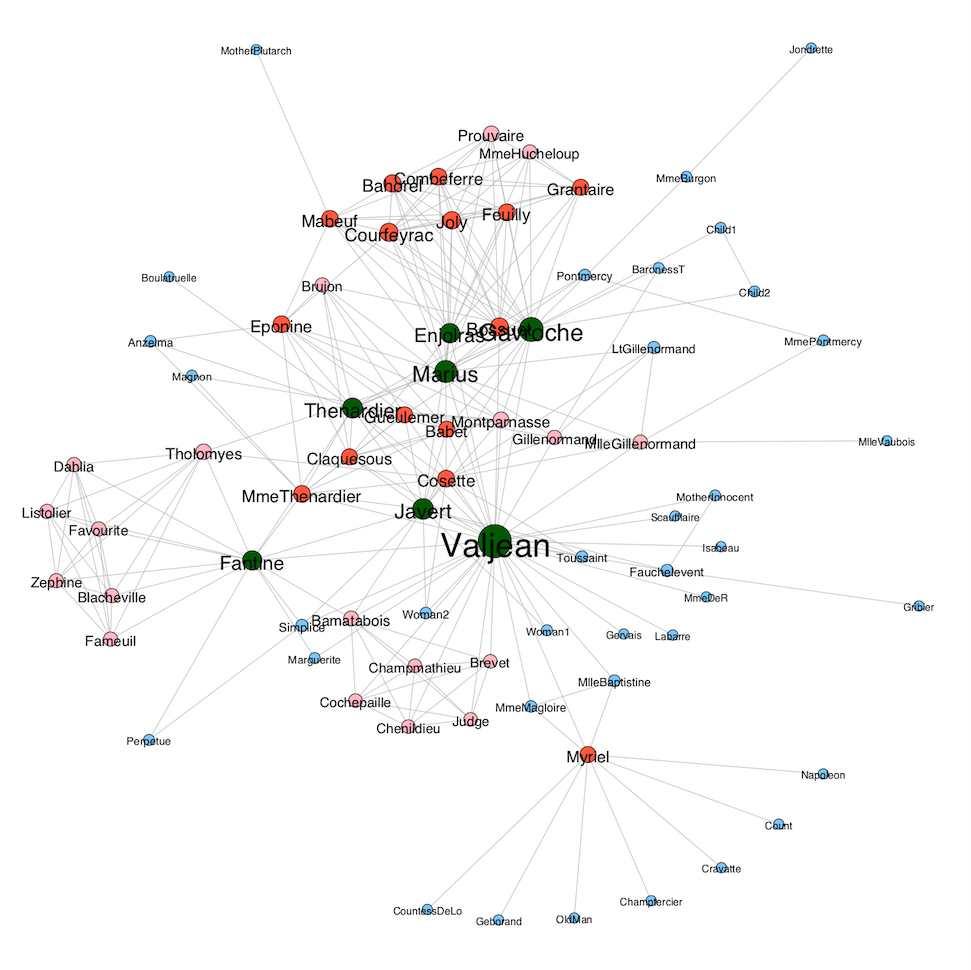
#coappearance network of characters in the novel Les Miserables
#from http://www-personal.umich.edu/~mejn/netdata/

#Import lesmiserables, which is in gml format
miserables = Graph.Read_GML('lesmiserables.gml')

#Check degree of each node
miserables.degree()
dict((x,miserables.degree().count(x)) for x in set(miserables.degree()))
Out[11]:
{1: 17,
 2: 10,
 3: 6,
 36: 1,
 4: 3,
 6: 5,
 7: 10,
 8: 1,
 9: 3,
 10: 5,
 11: 6,
 12: 2,
 13: 2,
 15: 2,
 16: 1,
 17: 1,
 19: 1,
 22: 1}
In [12]:
#Set the size for each vertex and vertex label based on degree
size_miserables = []
for i in range(len(miserables.degree())):
    size_miserables.append(miserables.degree()[i]+15)
In [13]:
#Create python dictionary to store plot arguments
vis_gml = {}

#Pass size argument to vis_gml dictionary,
#so the labels and nodes sizes are different based on degree
vis_gml["vertex_label_size"] = size_miserables
vis_gml["vertex_size"] = size_miserables
vis_gml["vertex_label_color"] = 'black'
vis_gml["edge_color"] = 'silver'

#Set the margin near the plot's edge
vis_gml["margin"] = 80
vis_gml["bbox"] = (1500, 1500)
In [14]:
#Write color argument for the nodes
miserables_col = []
for i in range(len(igraph.VertexSeq(miserables))):

    if miserables.degree()[i] >= 15:
        miserables_col.append('darkgreen')

    elif miserables.degree()[i] >= 10 and miserables.degree()[i] < 15:
        miserables_col.append('tomato')

    elif miserables.degree()[i] >= 6 and miserables.degree()[i] < 10:
        miserables_col.append('pink')

    else:
        miserables_col.append('lightskyblue')

vis_gml['vertex_color'] = miserables_col
In [15]:
#Set layout and print the plot
layout = miserables.layout('kk')
plot2 = igraph.plot(miserables, **vis_gml, layout = layout)
plot2.show()
Adjacency Matrix
In [16]:
#The following is an example adapted and changed from the folloing website,
#which create an adjacency matrix to read in igraph
#https://stackoverflow.com/questions/29655111/
#igraph-graph-from-numpy-or-pandas-adjacency-matrix

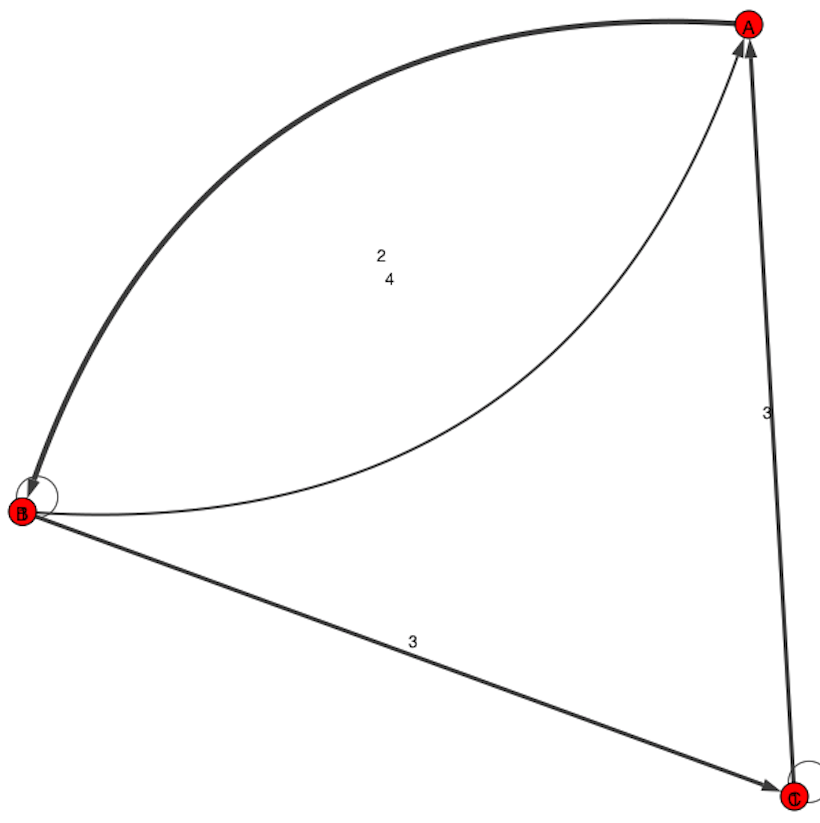
node_names = ['A', 'B', 'C']
df = pd.DataFrame([[0,4,0],[2,1,3],[3,0,1]], index=node_names, columns=node_names)
A = df.values
g = igraph.Graph.Adjacency((A > 0).tolist())
In [17]:
# Add edge weights and node labels.
weight_adj= list(A[A.nonzero()])
g.vs['label'] = node_names

vs = {}
vs["edge_width"] = weight_adj
vs["edge_label"] = weight_adj
vis_style["margin"] = 100
vis_style["bbox"] = (300, 300)
In [18]:
#igraph.plot(g, layout="kk", labels=True)

layout = g.layout('kk')
plot2 = igraph.plot(g, **vs, layout = layout, edge_label_dist = 5)
plot2.show()

Test data

Game of Throne (Season 3) Network

Les Miserable

Adjacency Matrix
Networkx
In [1]:
#Import libraries
import matplotlib as mpl
import matplotlib.pyplot as plt
import networkx as nx
import numpy as np
Test Dataset
In [2]:
#Import Test_Dataset.txt, which is created by hand,
#as a directed network by using the argument: nx.DiGraph()
with open('Test_Dataset.txt', 'rb') as file:
    #next(file, '')   # skip a line if the data has a header
    test = nx.read_edgelist(file, create_using=nx.DiGraph(), delimiter=' ', nodetype=int)
In [3]:
#Add up to 10 nodes
H = nx.path_graph(10)
test.add_nodes_from(H)


#List all the edges
list(test.edges)


#Add edges by hand
test.add_edges_from([(7, 1), (9, 7), (9, 6), (2, 4), (1, 8), (0, 8), (6, 7)])
In [4]:
#Another way to add Weights
test.add_weighted_edges_from([(0, 1, 0.6), (0, 2, 0.2), (0, 8, 0.1), (1, 3, 0.7),
                              (1, 8, 0.8), (2, 1, 0.3), (2, 4, 0.2), (3, 0, 0.1),
                              (3, 4, 0.5), (3, 3, 0.2), (5, 4, 0.3), (5, 6, 0.6),
                              (6, 4, 0.2), (6, 7, 0.1), (7, 1, 0.7), (9, 7, 0.9),
                              (9, 6, 0.3), (4, 3, 0.6)])
In [5]:
#Print the number of nodes and edges of the network
nx.number_of_nodes(test)
test.number_of_edges()
#Check the degree
test.degree()
print('\nTest Dataset:')
print(nx.info(test))
Test Dataset:
Name:
Type: DiGraph
Number of nodes: 10
Number of edges: 18
Average in degree:   1.8000
Average out degree:   1.8000
In [6]:
#Another way to change nodes' color by grouping the degree of the nodes
#Store the degree for each node in a list
dg_test = [d[1] for d in test.degree]


#Create a list that comtains the color choices for different degrees:
#dgree >= 5: crimson; degree < 5: teal
color_map_2 = []
for i in range(len(dg_test)):
    if dg_test[i] >= 5:
        color_map_2.append(('crimson'))
    else:
        color_map_2.append('teal')


#Create a list that comtains the node size choices for different degrees:
size_map = []
for i in range(len(dg_test)):
    size_map.append(test.degree[i]*100)
In [7]:
#Reset label
#Change nodes label
labeldict = {}
labeldict[0] = "Point 0"
labeldict[1] = "Point 1"
labeldict[2] = "Point 2"
labeldict[3] = "Point 3"
labeldict[4] = "Point 4"
labeldict[5] = "Point 5"
labeldict[6] = "Point 6"
labeldict[7] = "Point 7"
labeldict[8] = "Point 8"
labeldict[9] = "Point 9"


plt.figure(1)
Out[7]:
<Figure size 432x288 with 0 Axes>
<Figure size 432x288 with 0 Axes>
In [8]:
plt.figure(1)

#Set plot size
#plt.figure(figsize=(8, 8))
#Set the layout of the group, here is set to draw a circular graph
pos = nx.circular_layout(test)
<Figure size 432x288 with 0 Axes>
In [9]:
#Nodes arguments used, set node_size = size_map(based on degree), node_color = dg_test(based on degree),
#Method 1: The node_color can use an list, such as the degree, then use cmap to match the colors in mathplotlib
nx.draw_networkx_nodes(test, pos, node_size = size_map, node_color = dg_test, cmap = plt.cm.Reds_r)


#Method2: Use the color_map list that was stored previously
#nx.draw_networkx_nodes(test, pos, node_size = size_map, node_color = color_map_2)

#Group edges into two levels by weight > 0.5 and weight <= 0.5,
#The two groups can be used later when ploting the edges
elarge = [(u, v) for (u, v, d) in test.edges(data=True) if d['weight'] > 0.5]
esmall = [(u, v) for (u, v, d) in test.edges(data=True) if d['weight'] <= 0.5]


#Draw edges based on the two weight levels
nx.draw_networkx_edges(test, pos, edgelist=elarge,
                       width=3, edge_color = 'darkred')
nx.draw_networkx_edges(test, pos, edgelist=esmall,
                       width=1.5, alpha=0.5, edge_color = 'teal', style = 'dashed')


#Get and print the edge weights
edg_label = nx.get_edge_attributes(test,'weight')
nx.draw_networkx_edge_labels(test, pos, edge_labels = edg_label)


#Assign the labels to the plot
nx.draw_networkx_labels(test, pos, labels=labeldict, with_labels = True, font_size = 10, font_family = 'sans-serif')


#Show the plot
#plt.axis('off') #Hide the axis
plt.show()
Game of Throne
In [10]:
with open('stormofswords.txt', 'rb') as test:
    #next(test, '')   # skip a line
    got = nx.read_edgelist(test, create_using=nx.DiGraph(), data=(('weight',int),), delimiter=' ')


#Print the number of nodes and edges of the network
got.number_of_nodes()
got.number_of_edges()
#Check the degree
got.degree()
#Print the info of the network, which includes the number of nodes, edges,
#average in dgree and avg out degree
print('\nGame of Thrones:')
print(nx.info(got))


#Store the degree for each node in a list
got_dgr = [d[1] for d in got.degree]
dict((x,got_dgr.count(x)) for x in set(got_dgr))
Game of Thrones:
Name:
Type: DiGraph
Number of nodes: 107
Number of edges: 352
Average in degree:   3.2897
Average out degree:   3.2897
Out[10]:
{1: 16,
 2: 12,
 3: 8,
 4: 20,
 5: 11,
 6: 9,
 7: 6,
 8: 4,
 9: 1,
 10: 1,
 12: 3,
 13: 1,
 14: 3,
 15: 1,
 18: 3,
 19: 1,
 20: 1,
 22: 1,
 24: 1,
 25: 1,
 26: 2,
 36: 1}
In [11]:
#Create a list that comtains the color choices for different degrees:
color_map = []
for i in range(len(got_dgr)):

    if got_dgr[i] >= 20:
        color_map.append('red')

    elif got_dgr[i] >= 10 and got_dgr[i] < 20:
        color_map.append('darkorange')

    elif got_dgr[i] >= 5 and got_dgr[i] < 10:
        color_map.append('yellow')

    else:
        color_map.append('steelblue')


#Create size argument
size = []
for i in range(len(got_dgr)):
    size.append(got_dgr[i]*20)
In [12]:
plt.figure(2)
#Set plot layout, k = 1 which means the nodes are somehow apart from each other
pos = nx.spring_layout(got, k =1)


#Set nodes size based on degree
nx.draw_networkx_nodes(got, pos, node_size = size, node_color = color_map)


elarge_got = [(u, v) for (u, v, d) in got.edges(data=True) if d['weight'] > 30]
esmall_got = [(u, v) for (u, v, d) in got.edges(data=True) if d['weight'] <= 30]


#Draw edges based on the two weight levels
nx.draw_networkx_edges(got, pos, edgelist=elarge_got, width=2, edge_color = 'darkred')
nx.draw_networkx_edges(got, pos, edgelist=esmall_got, width=1.5, alpha=0.5, edge_color = 'lightblue', style = 'dashed')

#Get and print the edge weights
#edg_label_got = nx.get_edge_attributes(got,'weight')
#nx.draw_networkx_edge_labels(got, pos, edge_labels = edg_label_got)


#nx.draw(got, pos, with_labels = True)
nx.draw_networkx_labels(got, pos, with_labels = True, font_size=8, font_color='k', font_family='sans-serif')


plt.axis('off') #Hide the axis
plt.show()
Dolphins (glm)
In [13]:
dolphins = nx.read_gml("dolphins.gml")
#Find the clustering coefficient of the nodes
nx.clustering(dolphins) # for undirect type


#Extract the coefficients out from the clustering dictionary
clustering = list(nx.clustering(dolphins).values())

print("\nDolphins_gml:")
print(nx.info(dolphins))
Dolphins_gml:
Name:
Type: Graph
Number of nodes: 62
Number of edges: 159
Average degree:   5.1290
In [14]:
#Create a list that comtains the color choices for different degrees:
color_map = []
for i in range(len(clustering)):

    if clustering[i] >= 0.5:
        color_map.append('steelblue')

    elif clustering[i] >= 0.3 and clustering[i] < 0.5:
        color_map.append('skyblue')

    else:
        color_map.append('paleturquoise')


#Create size argument
size = []
for i in range(len(clustering)):
    size.append(clustering[i]*1000)
In [15]:
plt.figure(3)
#Set plot layout, k = 1 which means the nodes are somehow apart from each other
pos = nx.circular_layout(dolphins)


#Set nodes size based on degree
nx.draw_networkx_nodes(dolphins, pos, node_size = size, node_color = color_map)


#Draw edges based on the two weight levels
nx.draw_networkx_edges(dolphins, pos, width=1.5, alpha=0.5, edge_color = 'peachpuff')


#nx.draw(got, pos, with_labels = True)
nx.draw_networkx_labels(dolphins, pos, with_labels = True, font_size=8, font_color='k', font_family='sans-serif')


plt.axis('off') #Hide the axis
plt.show()
Adjacency Matrix
In [16]:
#Create adjacency matrix
#The following codes are adapted and changed from the following example:
#https://networkx.github.io/documentation/stable/auto_examples/drawing/
#plot_directed.html#sphx-glr-auto-examples-drawing-plot-directed-py

#Create a numpy matrix
A = np.matrix([[0,4,0,2],[0,0,1,3],[3,0,0,2],[2,0,1,0]])
#Read the numpu matrix as network
G = nx.from_numpy_matrix(A, create_using=nx.DiGraph())

#Print information about the adjacency matrix network
print("\nAdjacency Matrix:")
print(nx.info(G))

plt.figure(4)
Adjacency Matrix:
Name:
Type: DiGraph
Number of nodes: 4
Number of edges: 8
Average in degree:   2.0000
Average out degree:   2.0000
Out[16]:
<Figure size 432x288 with 0 Axes>
<Figure size 432x288 with 0 Axes>
In [17]:
#Set the plot layout
pos = nx.spring_layout(G)


#Store the degree for each node in a list
G_dgr = [d[1] for d in G.degree]
dict((x,got_dgr.count(x)) for x in set(got_dgr))
Out[17]:
{1: 16,
 2: 12,
 3: 8,
 4: 20,
 5: 11,
 6: 9,
 7: 6,
 8: 4,
 9: 1,
 10: 1,
 12: 3,
 13: 1,
 14: 3,
 15: 1,
 18: 3,
 19: 1,
 20: 1,
 22: 1,
 24: 1,
 25: 1,
 26: 2,
 36: 1}
In [18]:
#Get and print the edge weights
edg_label_G = nx.get_edge_attributes(G,'weight')
nx.draw_networkx_edge_labels(G, pos, edge_labels = edg_label_G, label_pos = .5,
                             font_size = 7, font_color = 'salmon')

#Change the node sizeand color for different nodes based on degree
node_sizes = [i * 100 for i in G_dgr]
node_colors = [i/10 for i in G_dgr]

#Change edge colors based on weight
M = G.number_of_edges()

edge_colors = list(edg_label_G.values())
#Set the transparency level of the edge
edge_alphas = [(5 + i) / (M + 4) for i in range(M)]


#Draw node and change color
nodes = nx.draw_networkx_nodes(G, pos, node_size = node_sizes, node_color='firebrick')
                               #node_color = node_colors, node_cmap = plt.cm.Reds)


edges = nx.draw_networkx_edges(G, pos, node_size = node_sizes, arrowstyle = '->',
                               arrowsize = 10, edge_color = edge_colors,
                               edge_cmap = plt.cm.Reds, width = 2)

# set alpha value for each edge
for i in range(M):
    edges[i].set_alpha(edge_alphas[i])


pc = mpl.collections.PatchCollection(edges, cmap = plt.cm.Reds)
pc.set_array(edge_colors)
plt.colorbar(pc)

nx.draw_networkx_labels(G, pos, with_labels = True)

ax = plt.gca()
ax.set_axis_off()
plt.show()
In [ ]:
